

The goal of this project was to develop a practical, robust kernel mixture model of a data space that can provide class probabilities for any given data sample. Secondary goals included adding a topographic constraint and arranging multiple instances of the model in a hierarchy. This project would later become the sensory/motor cortex component in a larger brain-inspired architecture.
This unsupervised learning system could be used for both probability density estimation (i.e. what is the data density near a data sample?) and for pattern classification (i.e. to which class/category does a data sample most probably belong?). Much of this work was based on the kMER algorithm by Marc Van Hulle.
For of the second half of 2008 I revisited the issue of sensory and motor representation. I had implemented some initial ideas at the end of 2006, but I hadn't taken the time to study things in depth. My goal here is to represent real-valued sensory and motor spaces as efficiently as possible with limited resources. For example, say we're talking about visual sensory data (i.e. pixel arrays) involving 100 pixels (10x10 image), and we only have the resources to represent the 28 most common visual patterns. If we want to represent that visual space efficiently, we have to move our 28 basis vectors around the 100-dimensional space so that the resulting vectors represent the 28 most common visual patterns. This all must be learned online (in real time) as the system is experiencing visual data. Then, after learning, each incoming image will be classified as one of those 28 "categories."
One approach is based on the standard statistical approach of maximum likelihood learning. We assume the basis vectors are the center points of Gaussian kernels, each with a corresponding variance. For each data sample, we compute the probability of seeing that sample. (Given our current model, i.e. the 28 Gaussian centers and variances, what's the probability that the data sample was "generated" by our model?) Maximum likelihood learning attempts to adjust the Gaussian kernel positions and sizes within the data space to maximize this probability value over all data samples. The end result should be the model that best represents the actual data distribution.
Another approach is based on information theory, specifically the mutual information between the "input" and "output" variables. (This idea is usually attributed to Ralph Linsker at IBM Research, who called it "infomax." Thanks to my former colleagues at IBM Research for introducing me to this idea.) I like to think of it this way: the data samples are coming from a real-valued input variable, V. We want to classify those samples into a discrete number of classes which represent the discrete class variable C. Each Gaussian kernel represents one class in C. Now, for each sample v, we want to transmit the maximum amount of information to the output class variable. We can do this by maximizing the mutual info between V and C, given the constraint of limited resources (i.e. a finite number of Gaussian kernels).
How do we do this? There are several ways. The simplest way to get started is to do gradient ascent on the mutual info. (Take the derivative of the expression for mutual info between V and C with respect to the Gaussian kernels' parameters, then continually adjust those parameters to increase the mutual info.) However, this direct gradient-based approach is hard to derive for mutual info because it depends on terms that are difficult to estimate; also, the resulting learning rules are (in my experience) unstable, similar to EM and max likelihood learning.
In general, any learning objective can be used as long as it generates a model with two properties: maximal prior entropy and minimal posterior entropy. Before seeing each data sample, the prior distribution over C should be uniform (maximum entropy/uncertainty), ensuring that each kernel is utilized equally (i.e. we're not wasting resources). After seeing each sample, the posterior distribution over C should be totally peaked on one class/kernel, representing minimal entropy/uncertainty. This is true when the Gaussian kernels are distinct, not overlapping. Thus, for each data sample received, we're reducing uncertainty as much as possible, which is equivalent to transmitting the greatest amount of information.So I've been working on an infomax-inspired algorithm to represent real-valued data vectors optimally with limited resources. I say infomax-inspired because it's learning goal isn't exactly infomax: it's a heuristic with goals similar to infomax that provides very robust results... and hopefully it approaches infomax as the number of kernels increases. One tricky issue is that the posterior probability calculations (needed for pattern classification) require an accurate estimation of the probability density at each data sample, but I think I have a good solution. The current version appears to be great at pattern classification (< 10% error on the classic Iris data set and < 4% error on a handwritten digits set). More importantly, it should be just what I need for the core of my sensory and motor cortex systems.
The mixture model can be modified to include a topography constraint (like self-organizing maps), forcing kernels that are nearby in some (e.g. 2D square) lattice to be nearby in data space.
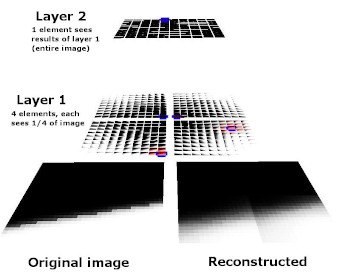
Also, large-dimensional data spaces can be partitioned and modeled with separate mixture models, whose "outputs" (vectors of kernel activation values) can then be treated as data and fed to another layer in a hierarchy. This provides the benefit of breaking up the high-dimensional data into several lower-dimensional spaces to be processed independently. Lower dimensionality is almost always easier to deal with in machine learning.
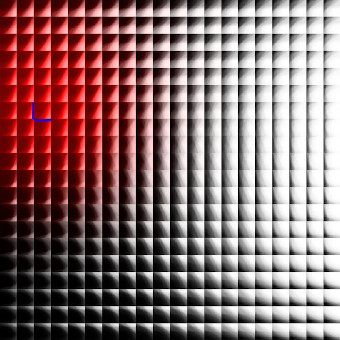
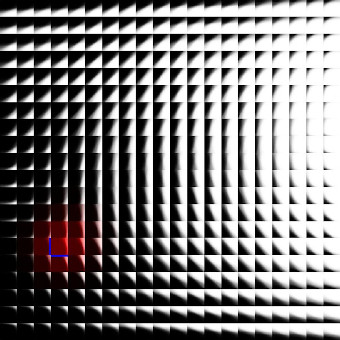
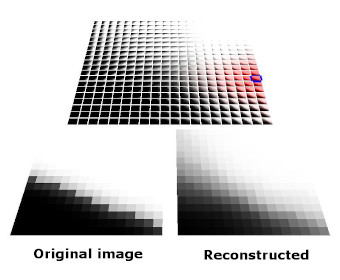
The images below show an earlier version of this system learning to represent a simple visual space (i.e. simple black and white edges). Each kernel is represented here by its vector/center point in image space. Also shown here are both the topographic constraint (nearby kernels representing similar patterns) and hierarchical arrangement of mixture models.


